Housing
Housing conditions have a significant impact on quality of life. Housing statistics deal with the following areas: state of housing, trends in housing construction, real estate market processes, state of home lending.
Key figures
Number of dwellings built
Indicator description
Number of dwellings put to use during the given period.
Source of data:
Summary Tables (STADAT)
Last data for period: Q1 2024
Aggregated housing price index
Indicator description
Changes in the housing market price level, 2015=100.0%
Source of data:
Summary Tables (STADAT)
Last data for period: Q4 2023
Number of home building permits and declarations issued
Indicator description
Change in the number of dwellings to be built on the basis of building permits issued and simple announcements.
Source of data:
Summary Tables (STADAT)
Last data for period: Q3 2023
Stock of housing loans
Indicator description
Change in the total amount of home loans at the end of the reference period compared to the same period of the previous year.
Source of data:
Summary Tables (STADAT)
Last data for period: Q3–4 2023
Featured
The Weekly Monitor has been renewed
The HCSO Weekly Monitor is replaced by the HCSO Monitor starting 11 October 2023. The interactive collection of figures, available on the HCSO website, continues to inform about the latest domestic and international social and economic trends, at the same time figures of First Releases have been added to the subjects, as such the content of its categories changed to a certain extent.
The figures of the HCSO Monitor may be downloaded, as before, in image and data formats (PNG, SVG and CSV).
Feel free to browse the latest data of the HCSO!
The figures of the HCSO Monitor may be downloaded, as before, in image and data formats (PNG, SVG and CSV).
Feel free to browse the latest data of the HCSO!

Low housing construction activity boosted by only a few major projects, Dwelling construction, construction permits, quarter 1 2024
In quarter 1 2024, 2,779 new dwellings were built, 23% fewer than a year earlier. The number of dwellings to be built on the basis of issued building permits and simple declarations was 4,524, 9.3% lower than in the same period of 2023.

Residential mortgages, 2023
The housing loan stock in Hungary stood at HUF 5,003 billion at the end of 2023, which was 1.5% higher than at the end of 2022. The growth rate of the housing loan stock slowed down compared to the annual growth rate of 7.5% in 2022 and between 9% and 15% in the four preceding years. The ratio of housing loans to GDP declined from 7.5% at end-2022 to 6.7%.

HCSO–ingatlan.com-rent index, March 2024
In March 2024, rents continued to rise: nationally they increased by 0.8% and in Budapest by 1.8% in one month. In nominal terms, March rents were 11.7% higher nationally and 12.4% higher in Budapest than in the same period last year, and 101% and 94% higher than in the base period of 2015. The real rent index was 23% higher than the 2015 base nationally and 19% higher in the capital.
HCSO–ingatlan.com-rent index, February 2024
In February 2024 rents rose at a slower pace than in the previous month: by 1.0% nationally and by 1.1% in Budapest. In nominal terms, February rents were 11.6% higher nationally and 11.3% higher in the capital than in the same period of the previous year, and 100% and 90% higher than in the base period of 2015. The real rent index exceeded the 2015 base by 23% nationally, and by 17% in Budapest.

Housing prices, housing price index, Q3 2023
In Q1-3 2023, 31% fewer homes were sold than in the same period of the previous year. In each quarter, sales were down compared to a year earlier, but the rate of decline has slowed. After an initial price increase, both the second-hand and new housing markets showed a slight decline in the third quarter (-0.6% and -1.8% respectively) compared to the previous quarter. The deterioration in the market position of detached houses continued, with their average price per square metre down by 8.1% nationally.

Statistical Yearbook of Hungary, 2022
Tens of thousands of data of the approximately 500 tables, graphs and maps offer an overview of Hungary’s demographic, social and economic processes, its environmental specifics and their timely changes. Unemployment in the 15–74 age group decreased year-on-year, being 3.6% in 2022. We amass this year commercial, private and other accommodation establishments in one unit, a novelty approach of our publication, providing a better picture about tourist traffic. Tourism nights at accommodation establishments were 39 million 821 thousand in 2022.

Hungary, 2022
The processes taken place in 2022 were mainly determined by the uncertain global environment due to the Russia-Ukraine war and the general and considerable price increases worldwide. Despite these challenges, the Hungarian economy's performance expanded by 4.6% year-on-year, above the EU average. Employment reached a new record high and average earnings rose significantly, but the impact of this was gradually eroded by surging inflation. Population decline continued at a lower pace than in the previous year.

Statistical Pocketbook of Hungary, 2022
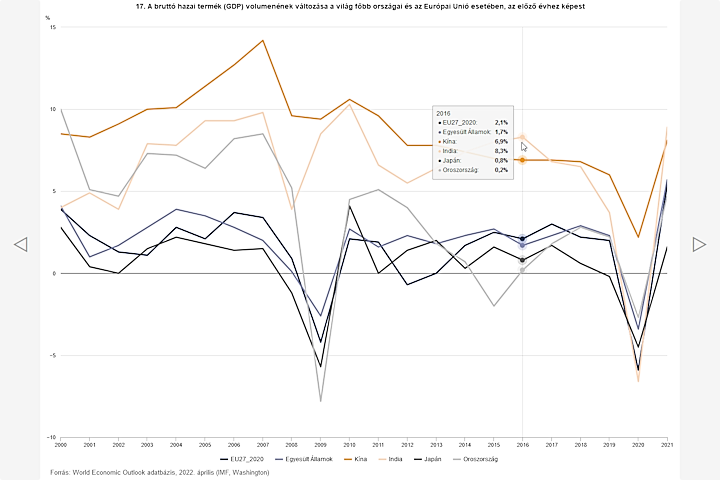
Despite the adverse economic effects, GDP volume in 2022 was 4.6% higher than a year earlier, while the employment rate expanded to 74.4%. Fewer deaths followed the end of the pandemic, but the birth rate also fell compared to 2021. In addition to the above data, the tables and graphs in the latest edition of the Statistical Pocketbook of Hungary, published every spring, provide a comprehensive insight into the evolution of social and economic trends in Hungary in 2022.
Related themes
- Censuses
- Construction
- Energy
- Environment, public utilites
- Government finance
- Income and consumption
- Living conditions
- Population and vital events
- Prices
- Regional statistics
Methodological information
First releases |
Latest release | Next release |
|---|---|---|
| Dwelling construction, construction permits, quarter 1 2024 | 03/05/2024 | 31/07/2024 |
Release and revision calendarPublication repertory
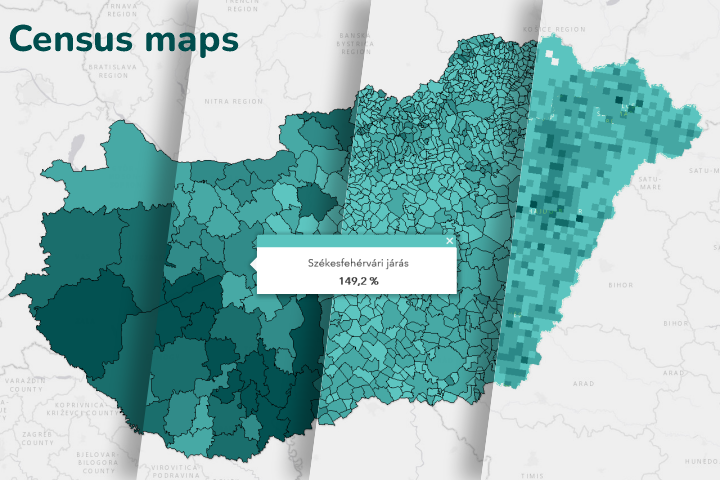
Census data |
Census |
|---|---|
| National regional data | Population census 2011 |
| 2. Main characteristics of the population and the dwellings | Microcensus 2016 |
Data visualisations